Java stack size weirdness, JMeter in pain
Now that my workstation is armed with 3GBs of RAM, I wanted to re-run the load test with greater number of threads allocated. This, of course, requires proportionately greater heap size, so there... I understand 64-bit JVM's stack size is quite large, thus I allowed Glassfish to use up to 2 GBs of RAM for the heap, and I instructed it to create up to 2500 threads in pool, having number of requests to process being same 2500. Fired the server up.
Now, load clients. Fired up the Linux machine upstairs (the one on the wireless connection), connected to it using PuTTY, directing X traffic through a tunnel to local X server courtesy of Cygwin X. When I ran JMeter 2.1.1 there last time, configuration was changed there and then, so I was greatly surprised to see "Segmentation fault" as I tried to launch it. Hmm... Increased stack size to 128k: launches fine. And here's the kicker: I exited JMeter, edited its script to _again_ have stack size of 48k and... it worked fine! What is this mystery? Why would Java 1.5 not launch the first time with smaller stack size, but once it had ran with greater stack size, it would have no problem running with the small? Anyway...
And now, JMeter in pain! (Shouted in low voice with reverberation added). So, Glassfish was running happily for some while, utilizing 1.6GB out of allowed 2GB, consuming remainder of 77% CPU idle while supporting slightly in excess of 2k concurrent connections (judging by both "therads busy" and "connections open"). Linux load client was running 800 threads, Windows load client - 1600. And then I decided to peek at Google Analytics statistics for my blog. Jmeter was not too happy to share the resources:
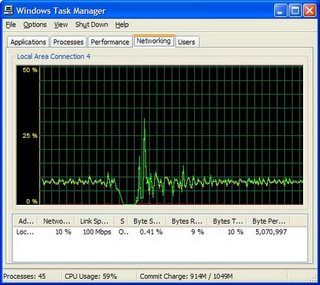
But as you can see it recovered.
What else... Ah, yeah, Google Analytics, pertty amazing stuff. It's amusing to know that my other blog entry "The purpose of life", being completely worthless and uninteresting, was in fact viewed by some person from Tulsa.
posted by denka at 11:24 AM
![]()

3 Comments:
Interesting results. I'm actually surprised you were able to run 800 concurrent threads. Being a jmeter committer, I've run jmeter with 500 threads with zero wait time. A more realistic setting is 250-300 threads per jmeter client. JMeter in GUI mode is very heavy. In console mode, 500-600 threads is feasible with short wait times. Supporting 800 or more concurrent threads in JMeter is challenging. It's one area where Jmeter is really weak. About the only way to do it effectively is to have each system handle 500 threads. I haven't tried JMeter on a large SMP system, but in theory one could launch several instances on a large box.
peter lin
While there is a wait time in my case (Gaussian-distribution controller with constant delay of 2 sec and deviation of 5 sec), it's more important that each request takes 30 seconds to complete on the server (I just put the current thread to sleep in JSP). So, therse requests necessarily overlap. As far as running multiple instances wired to a single GUI instance, the only time I tried that it left a very bitter taste :) Somehow, too much information is relayed to GUI instance, even if the only effect being observed is aggregate data. Does JMetere not aggregate on instances that are running the test in certain configurations? (I assume it' sto do with configuration I had... but I'm sure I did not ask to display the source of response, so doubling the bandwidth utilization when remote instance was launched was hard to explain.)
there is a setting in JMeter for distributed testing that changes how the results are returned to the console/gui.
in the past, when I've done stress testing, I used systems with dual ethernet cards and 2 switches. all jmeter traffic ie, master slave traffic) goes on 1 switch, while the other traffic (actual http requests) is on a separate one.
peter
Post a Comment
<< Home